Production analyses of dairy farms in the last 3 years in Europe
The Dataset we use for these analyses and benchmark are a unique set of data from dairy farmers who all use the UNIFORM software for many years in 4 different countries. All the farmers participate in the farm comparison and send in their summary of data monthly. Anonymously these data are used to analyze the situation in the 4 countries in this study. We are looking at a fixed group of farms in the 4 countries who join this farm comparison for minimum 3 years in a row. The data of the actual production are not rolling averages but just the productions levels in January (2019, 2020 and 2021). The countries are the Netherlands (1420 farms), Belgium (299 farms), Germany (170 farms) and UK (480 farms).
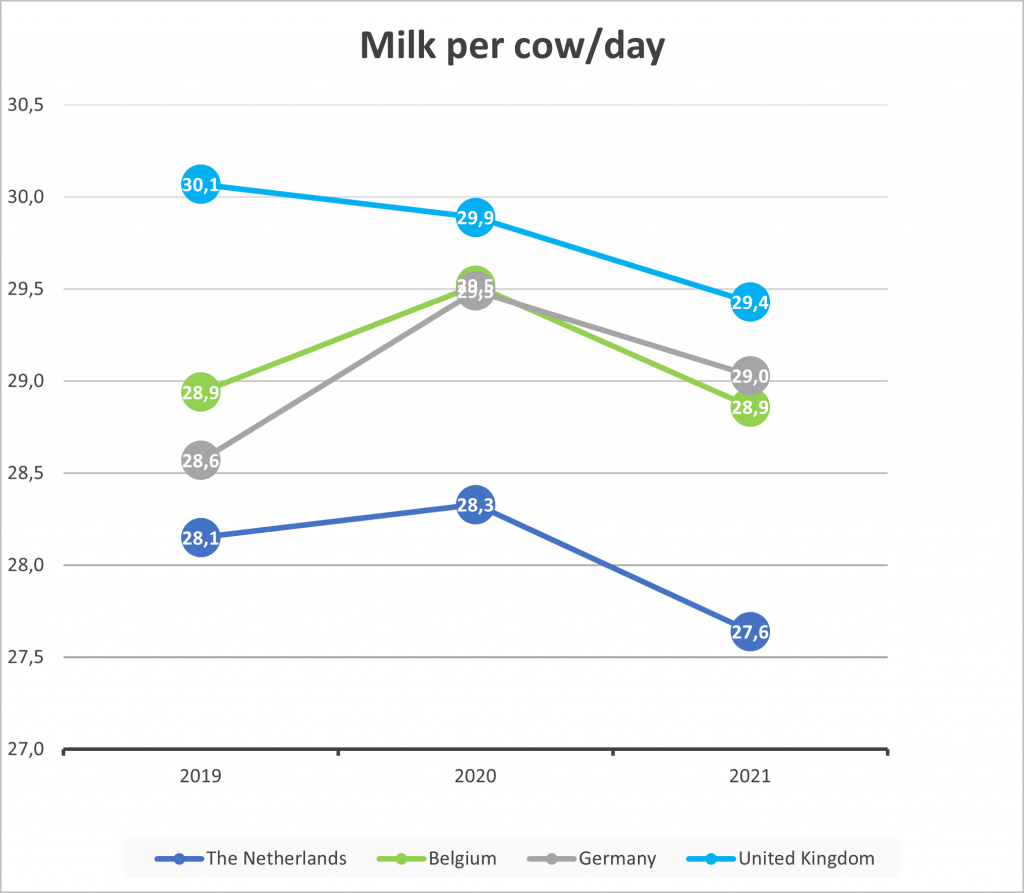
Initially we start with just looking at the average milk production (kg per cow per day) in January for 3 years in a row. The scale is detailed so the differences are not that extreme, but the trend is remarkable. We see in all countries that the January 2021 production was lower than 2020. Except the UK they all had their peak in 2020 and 2019 was also lower. An obvious explanation is not easy to be found.
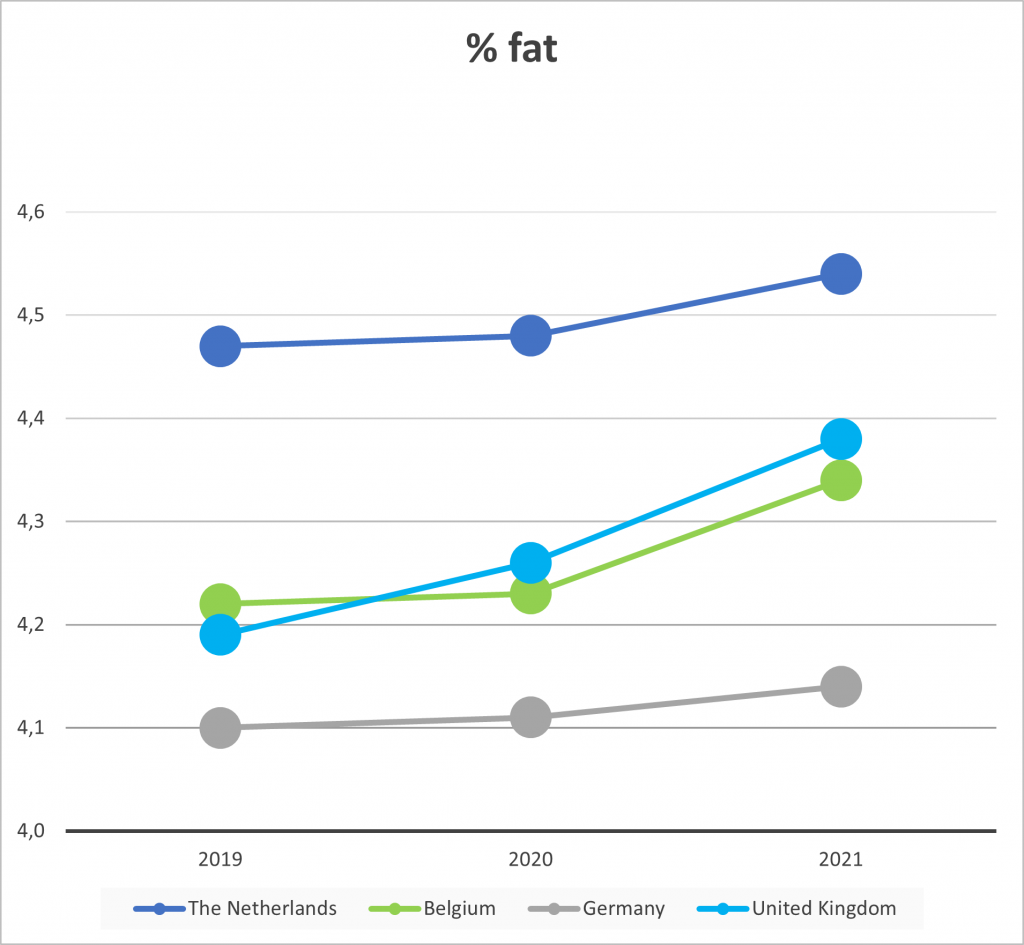
The production of cows is not only the milk, but also the components of the milk. The Fat and protein are important as well. We see from all farms in the 2nd graph that the Fat is higher in 2021, so that will compensate the lower Kg of milk. Germany increases the least.
SPP, a better tool to analyze
Milk production is influenced by many factors. Some are animal related, and some are non-animal related. With animal related factors the important ones are number of lactations, age, and Days in lactation. When there are many late lactation cows in a herd, we expect the production to be lower compared to a herd with a majority of early lactation cows. The same is true for a high or a low percentage of 1st lactation animals etc.
There are many more non animal related factors that influence the production levels. Feeding, housing, stress, water, bedding, etc. all have their impact on the production.
With the SPP (Standard Peak Production) we see milk production with the exclusion of the animal factors. So, we can compare averages much easier. We can compare an old cow with a younger one in the herd, for example. With SPP it is much easier to monitor herd management as the differences in SPP values are caused by non-animal factors, like feeding, transition period protocols, etc.
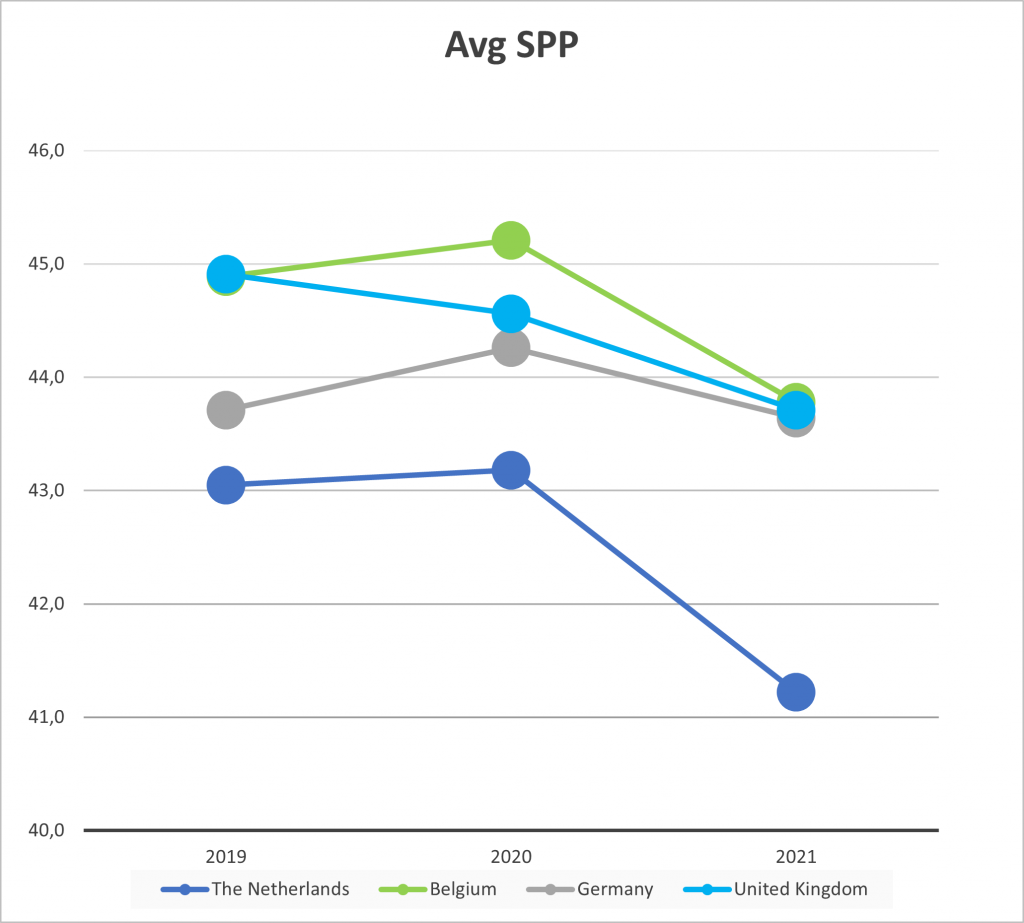
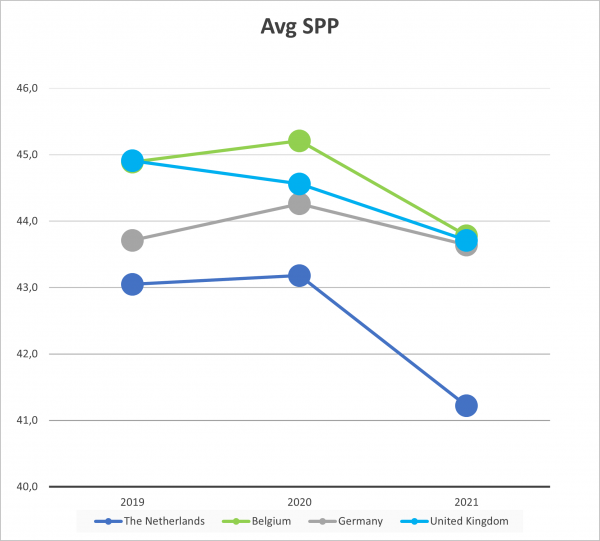
In the 3rd graph we see the SPP instead of the kg milk production, where there is a strange difference. The Belgian SPP is higher compared to the other countries and compared to the milk production in Kg. This is most likely caused by the fact that the Belgian farmers are expanding much more than the farmers in other countries (see previous articles). That is causing a lower average age of the herd. By taking out the cow-related factor, (much younger animals in Belgium) we see that the Belgian’s are the best producers in Kg milk.
In the 1st graph, looking at milk production including animal related factors, UK has the highest production. We can also see a dropping in the average SPP, like we saw in the avg milk production per cow and day. So, the trend is the same.
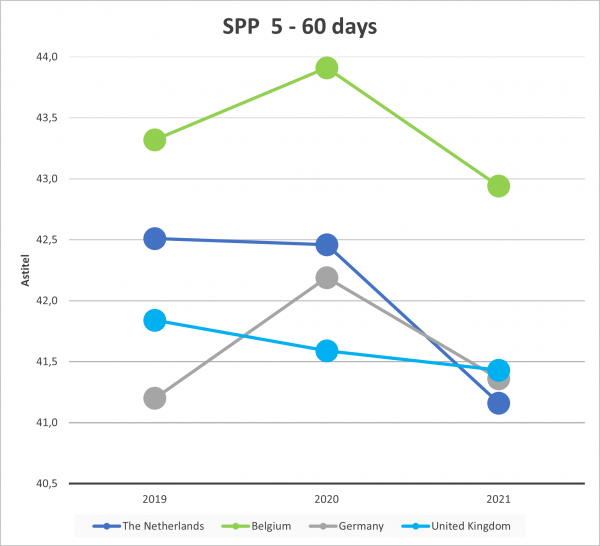
We can also look at the first 60 days in Lactation and compare the SPP between the countries over 3 years. SPP is always measured from 5 to 305 days in milk. We look at beginning of lactation and not to other periods because starting a new lactation is, probably, the most critical period in a cow’s life. Her welfare, feeding and health will determine the level of production during the rest of the lactation.
There, we see even the UK farmers dropping further away. As we said, the first 60 days are important, they are highly influenced by the transition cow management on the farm. The SPP over a whole lactation should be on the same level because the animal factors are taken out. SPP (standard peak production) takes all the cow differences already into account.
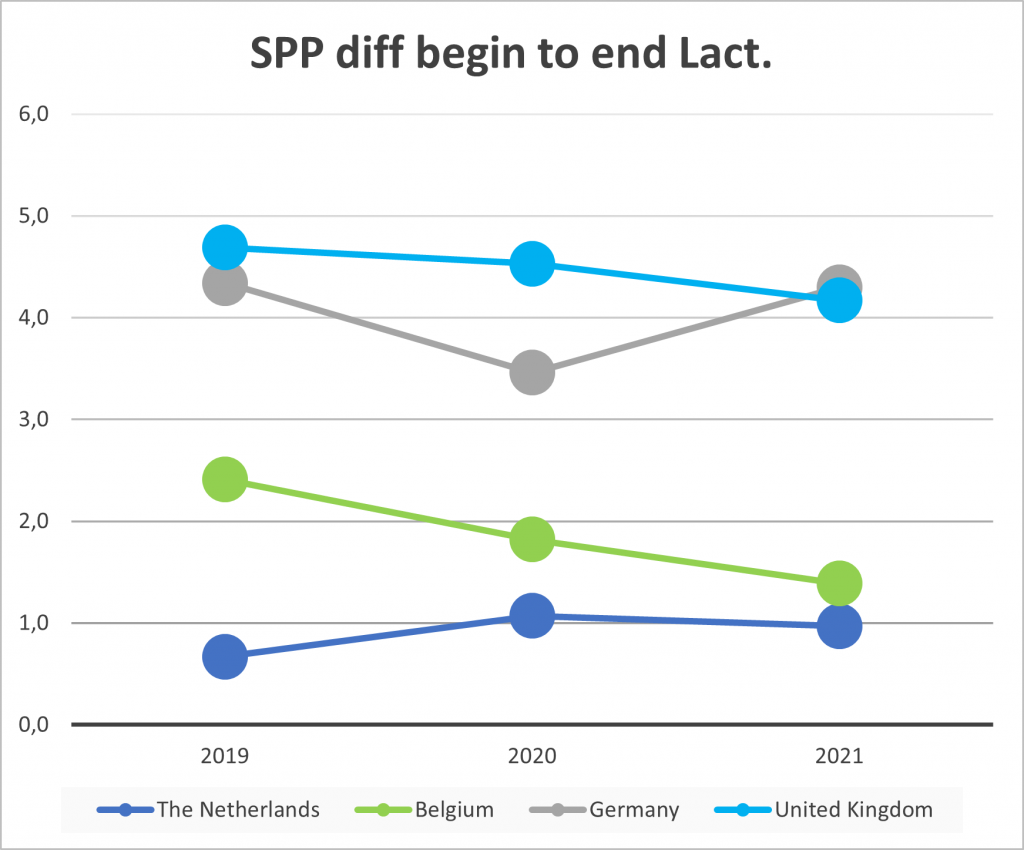
In the last graph we show the difference between the SPP in beginning of lactation (5 to 60 DIM) compared to the last part of the lactation (181 – 305 DIM). DIM is already filtered out by the SPP, therefore the difference is caused by something else related to environmental or management effects. So, we would like to see the smallest differences possible between lactation periods, ideally zero difference. A difference of 4 points in SPP value means farmer should review hazard points in the non-animal related aspects of herd management.
This graph shows huge differences per country. The UK but also the German farmers have a big gap between the SPP in the beginning of the lactation compared to the end of the lactation.
This means there are non-cow related factors that influence the SPP at start of the lactation and lower it. On average, these farmers should look in detail at how they are managing dry cows and transition cows to see what can be improved. The same should be done with 1st lactation animals before their 1st calving.
This could be feeding, several aspects of the transition, or regrouping protocols, among many other factors. Only by reviewing and analyzing the herd performance data more in depth will a farmer find what is causing this difference.
It is also clear that, in all countries, at the beginning of lactation the cows are not used to their maximum capacity of milk production and there is a serious hidden profit that could be recovered. Nevertheless, in the Netherlands the gap is minimum (maximum 1 point of difference). It is also a remarkable the trend in Belgium, where the gap has decreased over time.
Summary
The SPP (in the Netherlands called BSK) is a powerful tool to monitor the milk production performance in a very efficient way. Analyzing SPP, one can realize how successful the cattle handling, farm environment and protocols are for the cows. SPP is a perfect tool to highlight if there is something to be improved in the farm management. Farms with huge differences in the SPP (over 4 points) during the lactation have created a sub-optimum situation for the cows. Looking into that situation with experts can be very beneficial.
The Dataset we use for these analyses and benchmark are a unique set of data from dairy farmers who all use the UNIFORM software for many years in 4 different countries. All the farmers participate in the farm comparison and send in their summary of data monthly. Anonymously these data are used to analyze the situation in the 4 countries in this study. We are looking at a fixed group of farms in the 4 countries who join this farm comparison for minimum 3 years in a row. The data of the actual production are not rolling averages but just the productions levels in January (2019, 2020 and 2021). The countries are the Netherlands (1420 farms), Belgium (299 farms), Germany (170 farms) and UK (480 farms).
Initially we start with just looking at the average milk production (kg per cow per day) in January for 3 years in a row. The scale is detailed so the differences are not that extreme, but the trend is remarkable. We see in all countries that the January 2021 production was lower than 2020. Except the UK they all had their peak in 2020 and 2019 was also lower. An obvious explanation is not easy to be found.


The production of cows is not only the milk, but also the components of the milk. The Fat and protein are important as well. We see from all farms in the 2nd graph that the Fat is higher in 2021, so that will compensate the lower Kg of milk. Germany increases the least.
SPP, a better tool to analyze
Milk production is influenced by many factors. Some are animal related, and some are non-animal related. With animal related factors the important ones are number of lactations, age, and Days in lactation. When there are many late lactation cows in a herd, we expect the production to be lower compared to a herd with a majority of early lactation cows. The same is true for a high or a low percentage of 1st lactation animals etc.
There are many more non animal related factors that influence the production levels. Feeding, housing, stress, water, bedding, etc. all have their impact on the production.
With the SPP (Standard Peak Production) we see milk production with the exclusion of the animal factors. So, we can compare averages much easier. We can compare an old cow with a younger one in the herd, for example. With SPP it is much easier to monitor herd management as the differences in SPP values are caused by non-animal factors, like feeding, transition period protocols, etc.
In the 3rd graph we see the SPP instead of the kg milk production, where there is a strange difference. The Belgian SPP is higher compared to the other countries and compared to the milk production in Kg. This is most likely caused by the fact that the Belgian farmers are expanding much more than the farmers in other countries (see previous articles). That is causing a lower average age of the herd. By taking out the cow-related factor, (much younger animals in Belgium) we see that the Belgian’s are the best producers in Kg milk.

In the 1st graph, looking at milk production including animal related factors, UK has the highest production. We can also see a dropping in the average SPP, like we saw in the avg milk production per cow and day. So, the trend is the same.
We can also look at the first 60 days in Lactation and compare the SPP between the countries over 3 years. SPP is always measured from 5 to 305 days in milk. We look at beginning of lactation and not to other periods because starting a new lactation is, probably, the most critical period in a cow’s life. Her welfare, feeding and health will determine the level of production during the rest of the lactation.
There, we see even the UK farmers dropping further away. As we said, the first 60 days are important, they are highly influenced by the transition cow management on the farm. The SPP over a whole lactation should be on the same level because the animal factors are taken out. SPP (standard peak production) takes all the cow differences already into account.
In the last graph we show the difference between the SPP in beginning of lactation (5 to 60 DIM) compared to the last part of the lactation (181 – 305 DIM). DIM is already filtered out by the SPP, therefore the difference is caused by something else related to environmental or management effects. So, we would like to see the smallest differences possible between lactation periods, ideally zero difference. A difference of 4 points in SPP value means farmer should review hazard points in the non-animal related aspects of herd management.
This graph shows huge differences per country. The UK but also the German farmers have a big gap between the SPP in the beginning of the lactation compared to the end of the lactation.
This means there are non-cow related factors that influence the SPP at start of the lactation and lower it. On average, these farmers should look in detail at how they are managing dry cows and transition cows to see what can be improved. The same should be done with 1st lactation animals before their 1st calving.

This could be feeding, several aspects of the transition, or regrouping protocols, among many other factors. Only by reviewing and analyzing the herd performance data more in depth will a farmer find what is causing this difference.
It is also clear that, in all countries, at the beginning of lactation the cows are not used to their maximum capacity of milk production and there is a serious hidden profit that could be recovered. Nevertheless, in the Netherlands the gap is minimum (maximum 1 point of difference). It is also a remarkable the trend in Belgium, where the gap has decreased over time.
Summary
The SPP (in the Netherlands called BSK) is a powerful tool to monitor the milk production performance in a very efficient way. Analyzing SPP, one can realize how successful the cattle handling, farm environment and protocols are for the cows. SPP is a perfect tool to highlight if there is something to be improved in the farm management. Farms with huge differences in the SPP (over 4 points) during the lactation have created a sub-optimum situation for the cows. Looking into that situation with experts can be very beneficial.


