How to evaluate milk production performance using SPP
Imagine that you arrived at farm and faced two cows. The unique information that comes to you immediately is: one produces 25 L / day and the other 31 L / day. So, you are asked: which cow is the best in production?
We all know that it is very difficult to compare the productive efficiency of animals at the farm level or even at the individual level since animals are always at a different stages of lactation. If all animals on a farm were born on the same day, became pregnant at the same time and calved on the same day, then we would have a perfect herd for a comparing the productive efficiency of the animals since the all variables (age, time of gestation and days in lactation) would be the same. However, we know that this is impossible in reality!
There will always be variables: cows at the beginning, middle and end of lactation, cows in different lactations, some cows are pregnant and some are not. All these individual factors have a great impact when comparing the productive efficiency of the cow.
We know that even though the animals are selected in the same group or batch, their conditions are never exactly the same. It is important to note that fluctuations in milk production per group or batch are always influenced by management, and, as the management, we must be aware!
SPP (Standard Peak Production) is a calculation to correct the factors correlated to the animal (age, time of pregnancy and number of days in lactation) that influence milk production. This calculation is made by algorithms that correct the momentary milk production of cows to the same productive moment: adult cow (5.7-7.7 years), days in milk = 50 (peak) and same moment of gestation. Having these factors corrected, we can compare the SPP value of any cow and at any time during lactation with each other.
If we evaluate the milk production by itself, then we cannot assume whether the production at the moment is good or bad if we do not know the moment of the lactation curve of the animal. It is normal, for example, that the milk production decreases over time after peak production. Therefore, it is important to know stage of lactation in order to analyze productive efficiency. Additionally, it is important to consider reproductive stage and age, as you would expect different performances according to these factors. An analysis of this magnitude is not simple for even one animal. So, imagine doing that for a whole group or batch of animals! However, with SPP – exclusive in UNIFORM-Agri, this analysis becomes simple. The program already does all the calculations considering the registered milk recordings, reproduction status, and general information entered in the program.
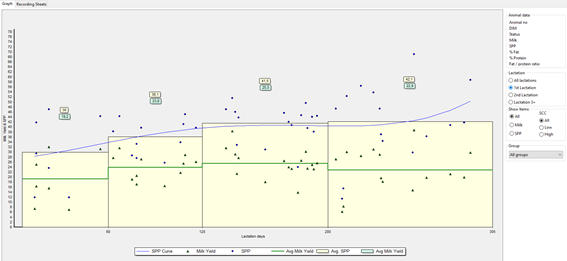
The chart below shows an SPP analysis by group. On the Y axis, there is a scale for milk production and SPP value. Each cow is considered by two dots: one has the last milk recording (green triangle), and the other one the SPP value (blue circle). On the X axis, we have the days in milk (DIM). The average milk production of the animals in the same DIM range is represented by the green line and the average of the SPP by the shaded rectangles:

In this example, we have selected a batch of first lactation animals. It is clearly observed that these animals are not having an optimal lactation curve. All animals in the interval (DIM 5-60) have a lower average milk production (green line) when compared to other phases. They have an SPP 30 at this phase, while in other intervals of DIM there are animals with better performance and an SPP average above 36 and 40.
There is not a “best” SPP, but the best situation leads your animals to express their maximum according to each phase. What can be expected when the animals are performing well is consistency in the SPP values at all DIM intervals, in other words, the blue SPP trend line is, ideally, a straight line and the rectangles in each DIM interval should be nearly even, because the value of production, regardless of the animal’s production phase, is corrected for the same moment for all animals.
That is very important because it is how we remove the animal factor and focus on the management factor. Considering the situation above, there is visible a management gap in this interval of 5-60 DIM first lactation animals. So, here management factors must be analyzed closely, such as: diet, group size, animal score, etc.
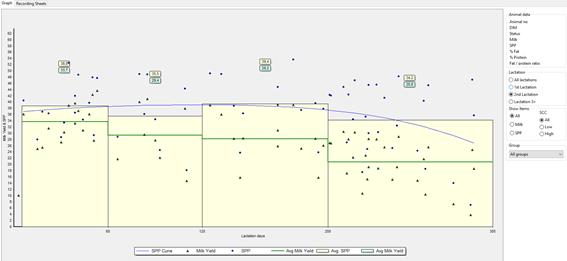
In the chart below, we have a group of second lactation animals. We observe that these animals, unlike the animals in the first graph, express a peak production because the green line in the DIM interval between 5-60 is greater than all other phases. It is also important to see that, although they expressed a higher SPP value in the DIM interval 120-200, the difference of the first 3 phases is low. If the difference between each interval is greater than 4 points then there is reason to be concerned about a reduction in production. For example, the last 2 intervals of DIM (120-200 and 200-305) in the chart below the drop in milk production was high. Observe the deviation of average milk production in both phases and as consequence the drop in SPP (5,2 points). It indicates a management issue at this phase.

A single milk recording is enough to calculate the closed lactation curve (305 days) of any animal in the UNIFORM-Agri software. The SPP will be calculated, but, obviously, more milk recording data points means more accurate SPP values.
This is an extremely useful and exclusive tool from UNIFORM-Agri, which greatly facilitates the analysis of the productive efficiency of your herd by identifying management opportunities. The program features several other analysis that involve SPP with reports that are easy to interpret. If you have any question, feel free to contact us. We will be happy to help you!
Nayara Magalhães Gonçalves
Veterinary Graduated at Federal University of Vicosa – MG
Market Support and Development Manager at UNIFORM-Agri


