Reproductive performance of dairy farms in the last 3 years in Europe.
As we explained in our previous paper, there is a unique dataset of dairy farms in Europe that have joined the farm comparison project of UNIFORM-Agri. With this dataset we can look at how these farm’s change over a period. We respect and maintain their privacy, so we only show the trend of the group of farms per country. Most of the data is yearly rolling averages and measured in January.
We have already shown the differences in herd size and sustainability. In this paper we will talk about the reproductive performance in farms from the same four countries: The Netherlands (1420 farms), Belgium (299 farms), Germany (170 farms) and UK (480 farms). All of them use the UNIFORM Herd management software or a branded version of it.
Speaking about reproductive performance there are a few Key Performance Indicators (KPI’s) to be monitored. The most important ones are included in our dataset. These are:
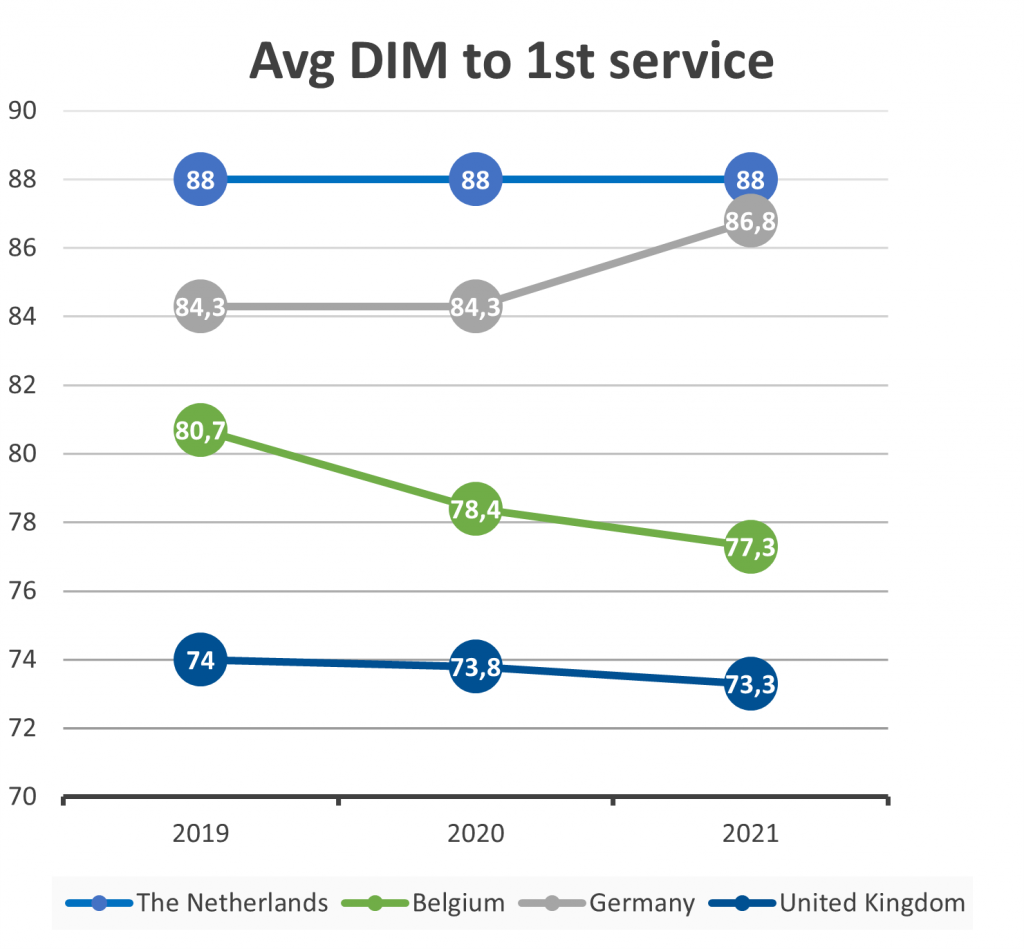
– Average number of days in milk to 1st service (Avg DIM to 1st service): for all cows in the herd, the average number of days after calving that cows are being inseminated/served.
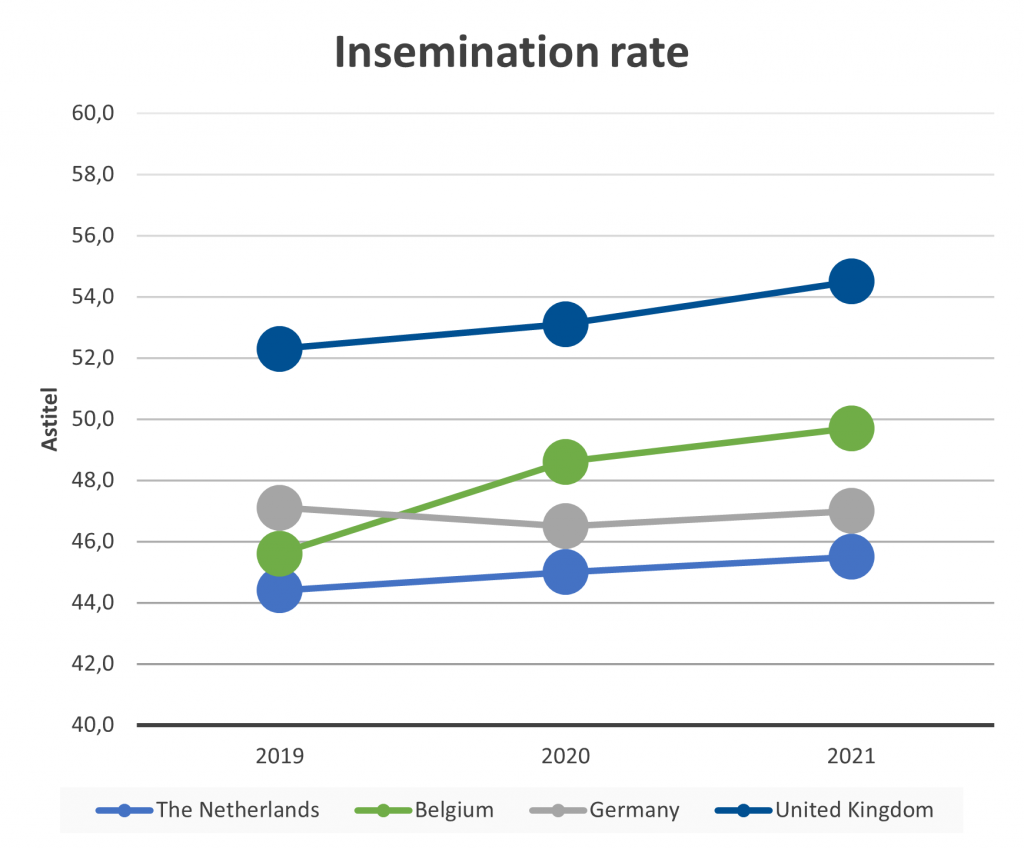
– Insemination rate (IR): from all eligible cows, how many of them have been inseminated/served.
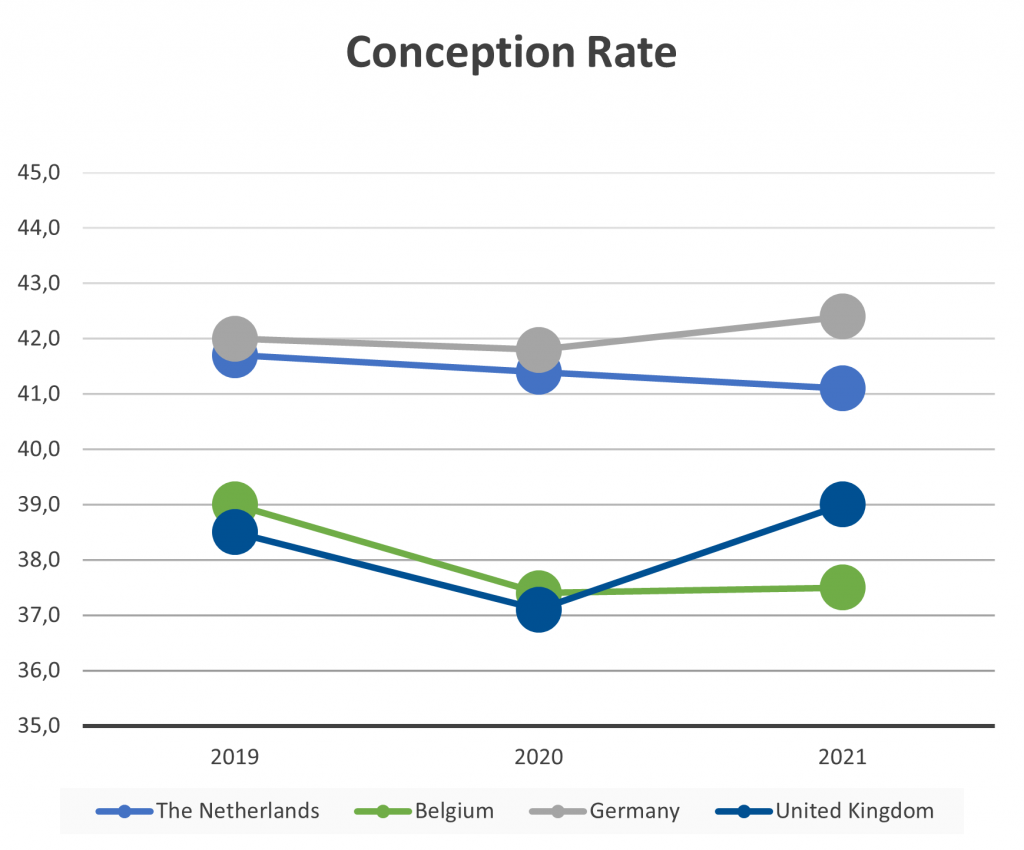
– Conception rate (CR): from all the inseminated cows, how many of the inseminations are successful.
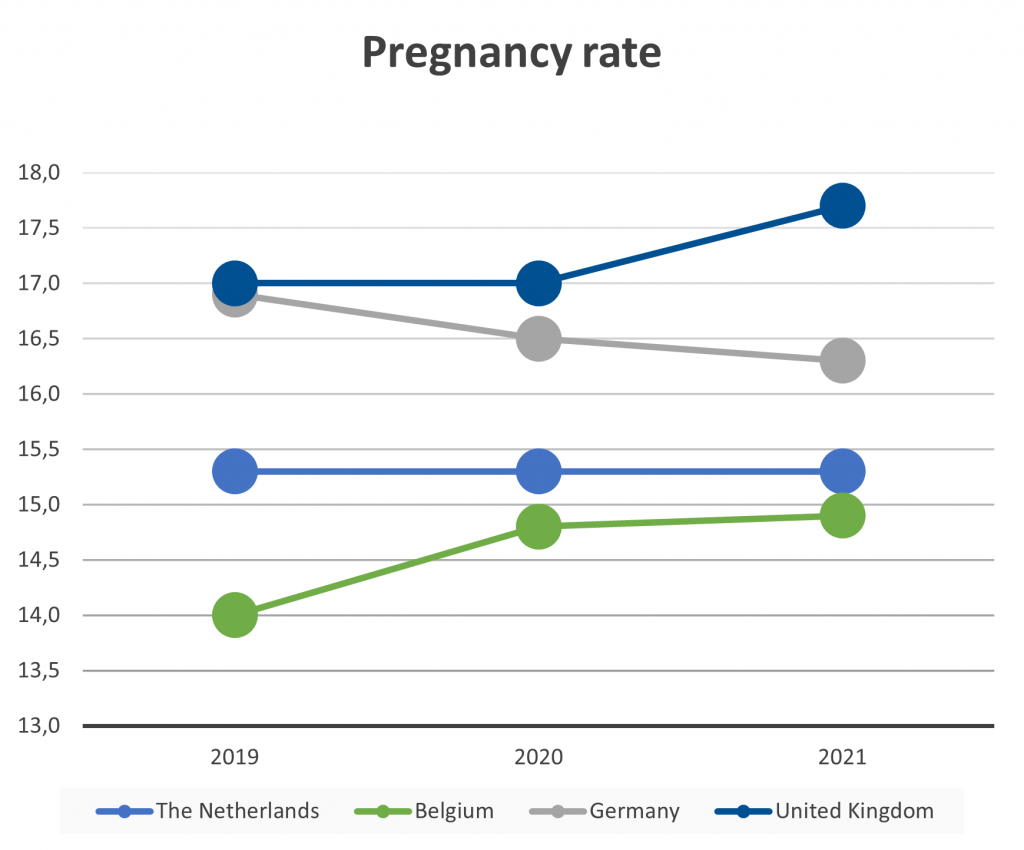
– 21 days Pregnancy rate (PR): a mix of the 2 previous KPIS. It is the result of IR * CR. Which means, from all eligible cows, how many are pregnant.
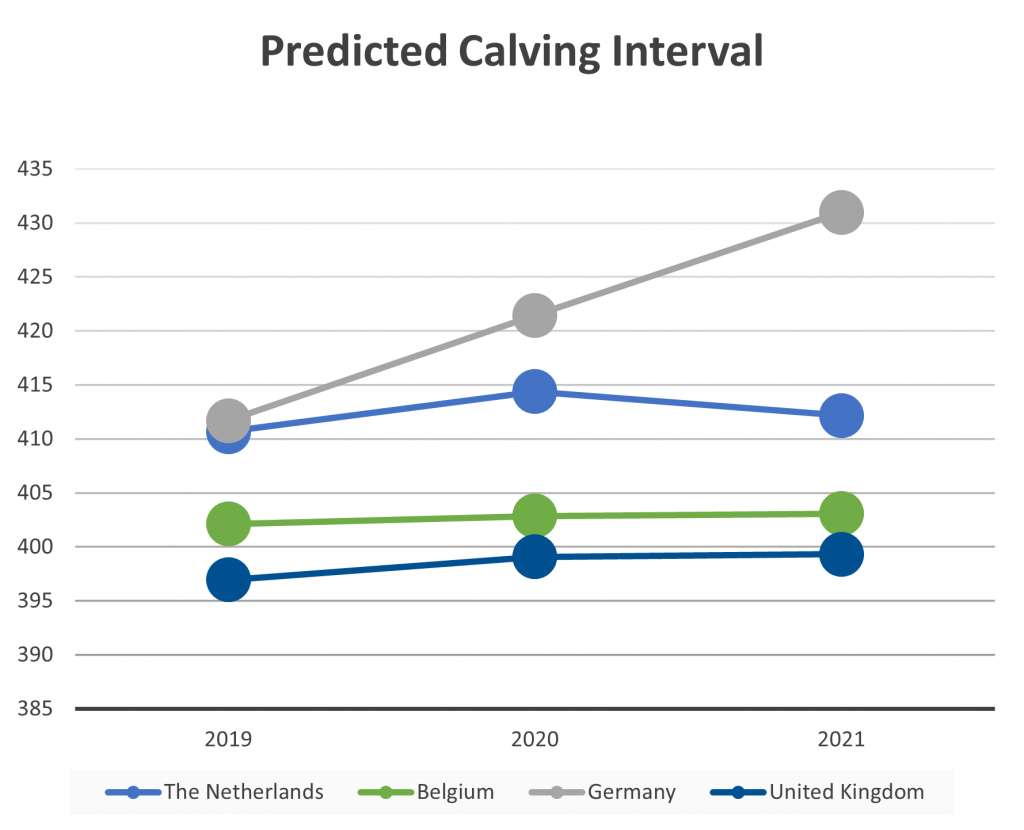
– Predicted Calving Interval: the estimation of how many days will be between the last calving and the next one. This KPI considers pregnant cows, inseminated without a diagnosis and open cows for the prediction.
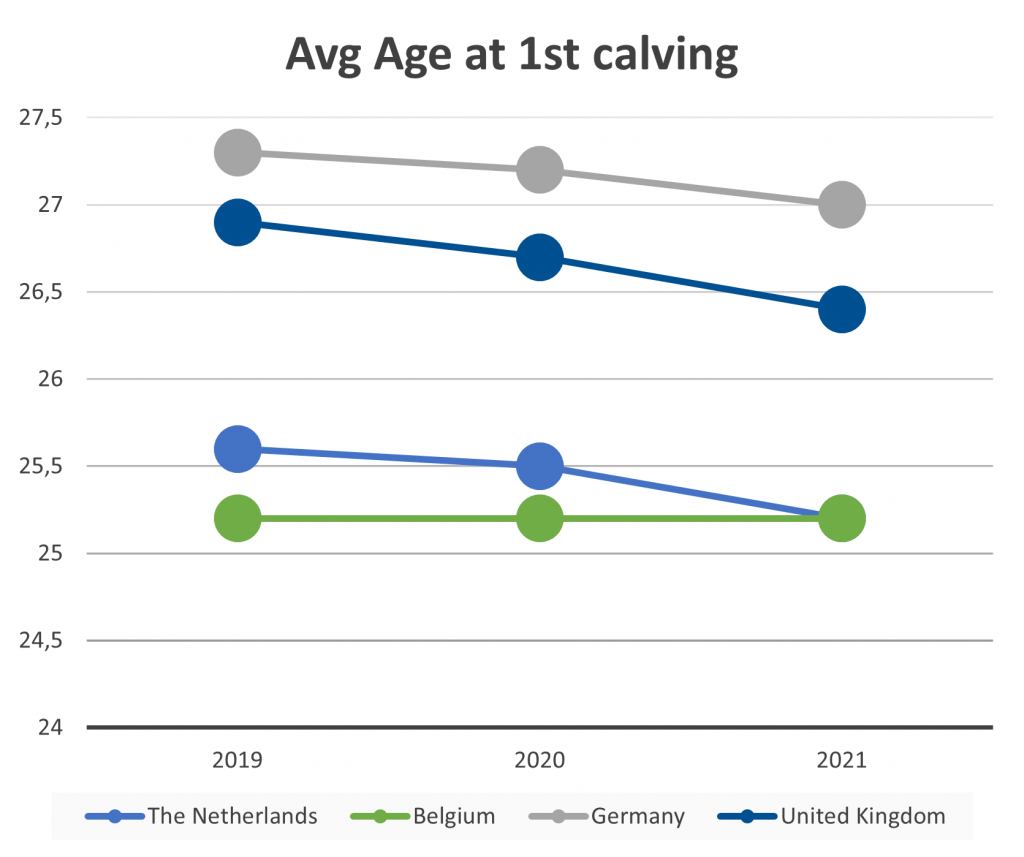
– Average age to 1st calving: a very important KPI for heifers. It is the average amount of time that it takes a heifer to get to their first calving and start being a productive animal in the herd.
Depending on herd management, we can consider a different value as good (or as a goal) for some of these KPIs. For example, for the Avg. DIM to 1st service or for the predicted calving interval.
For high producing farms, the goal would be to have a slightly longer calving interval and more days to 1st service than what is consider ideal in their area/country. Otherwise, cows would be dried off when they are still producing a lot of milk, so it is better to extend these periods in time.
For farms with lower production, on the other hand it would be better if these two KPIs are lower. Less days for calving interval and less Days in Milk (DIM) at 1st service. Cows will be dried off with low productions and interval between peaks of lactations will be shorter.
Other KPIs have same ideal values for all farms, independently of how much milk is produced. These are:
– IR: 60 to 70%
– CR: 40% for cows, 60% for 1st calvers
– PR: 20% or more
– Age at 1st calving: around 24 months of age
Analyzing data from the group of farms we are comparing; these are the results:
Avg days to 1st service:
The shortest interval between calving and 1st service is from UK farms. This could be because of different causes: very good management of transition cows, use of activity systems and sensors, or use of synch protocols on farm.
Values from Belgian farms have decreased 3.4 points during the 3 years of the analysis, while values for German farms have increased 2.5 points. Dutch farms were stable during this period.
Insemination rate, conception rate and pregnancy rate:
Results from IR show that highest values are from the UK, and Belgium is the second country with better results. Results from Dutch farms also increase in time. For Germany, there is a decrease in 2020 but then in 2021 appears to start recovering from it. None of the values are close to ideal values, we will see the impact of this later in this paper.
About CR, German farms are performing best in the group. Which shows that there are different ways of managing the reproduction of the herd and that does not mean one way is better than the other. This is highly dependent not only on the country situation, but also on farm circumstances and reality. Dutch farms have slightly decreased, and the results from the UK and Belgium are lower. UK farms decreased in 2020 but the final result in 2021 is an increase of 0.5 points. Belgium farms decreased too, but they have not improved.
From these three KPIs, probably PR is the most relevant, because it reveals indirectly how the other two KPIs are evolving.
Better PR value for UK farms is because they have the highest IR and also a very good CR. And there is an improvement of almost 1 point in the last year.
Dutch farms stay on the same level, because there was a small decrease in CR; but also an increase in IR in the last year. The impact of increasing IR more than 4 points in Belgian farms has resulted in a nice increase in PR too. On the other hand, the increase and good values in CR in German farms does not soften the results in IR.
Predicted Calving Interval:
The Graph shows an important increase (19 days) for German farms. This could be explained by the results from Avg DIM to 1st service, which are higher than in other countries. But also because of the IR results. Even having a good conception rate, which means many of the inseminated cows get pregnant, with the values of IR it is suggested that not enough cows are being detected in heat and being inseminated. And this has an impact in the number of days to get a cow pregnant, and therefore, in the calving interval. For the other three countries results are good and the performance is positive.
Average age at first calving:
All countries have improved in the performance of this KPI in the last 3 years. Heifers calved older in Germany and the UK compared to the Netherlands and Belgium. As it was shown in the previous paper, this is important for reproductive performance, but also for the sustainability of the farm.
We would like to highlight that the results and explanations are based on our dataset, analyzed as an isolated group of farms in the same situation. It is difficult to extrapolate this to the real world and it has to be taken into account that there are no better or poorer results, because herd management and herd performance are highly influenced by many factors not included in this analysis, such as milk price, feeding costs, labour, weather, country and regulations, etc,

Ir. Harm-Jan van der Beek

Almudena Molinero, DVM


